

Visualize
Ouster’s OpenGL-based visualizer allows for easy visualization from pcaps and sensors on all platforms the Ouster SDK supports.
Using ouster-cli is a fastest way to visualize data from a connected sensor, recorded pcap
or OSF files with SLAM poses:
If you’ve installed the ouster-sdk (see Python Installation) then
you’re all set to visualize with below command.
The following replays lidar data saved in a pcap file and visualizes the output. It will look for a
metadata json file with the same name as the PCAP file by default, but you can specify the metadata
explicitly. Set SAMPLE_DATA_PCAP_PATH (and optionally SAMPLE_DATA_JSON_PATH using -m if your metadata
is stored separately) before running:
ouster-cli source --meta {SAMPLE_DATA_JSON_PATH} {SAMPLE_DATA_PCAP_PATH} viz
Using an Ouster Sensor
The following visualizes lidar data arriving on a udp port.
Note
Connecting to an Ouster sensor is covered in the Networking Guide section of the Ouster Sensor Documentation.
Set SENSOR_HOSTNAME to your sensor’s hostname or IP before running:
ouster-cli source {SENSOR_HOSTNAME} viz
Note
To make sure everything is connected, open a separate console window and try pinging the sensor. You should see some output like:
$ ping -c1 <SENSOR_HOSTNAME>
PING <SENSOR_HOSTNAME> (192.0.2.42) 56(84) bytes of data.
64 bytes from <SENSOR_HOSTNAME> (192.0.2.42): icmp_seq=1 ttl=64 time=0.217 ms
PS > ping /n 10 <SENSOR_HOSTNAME>
Pinging <SENSOR_HOSTNAME> (192.0.2.42) with 32 bytes of data:
Reply from 192.0.2.42: bytes=32 time=101ms TTL=124
Note that you may have to use ouster-cli source $SENSOR_HOSTNAME config first to configure your sensor properly.
You should get a view similar to:
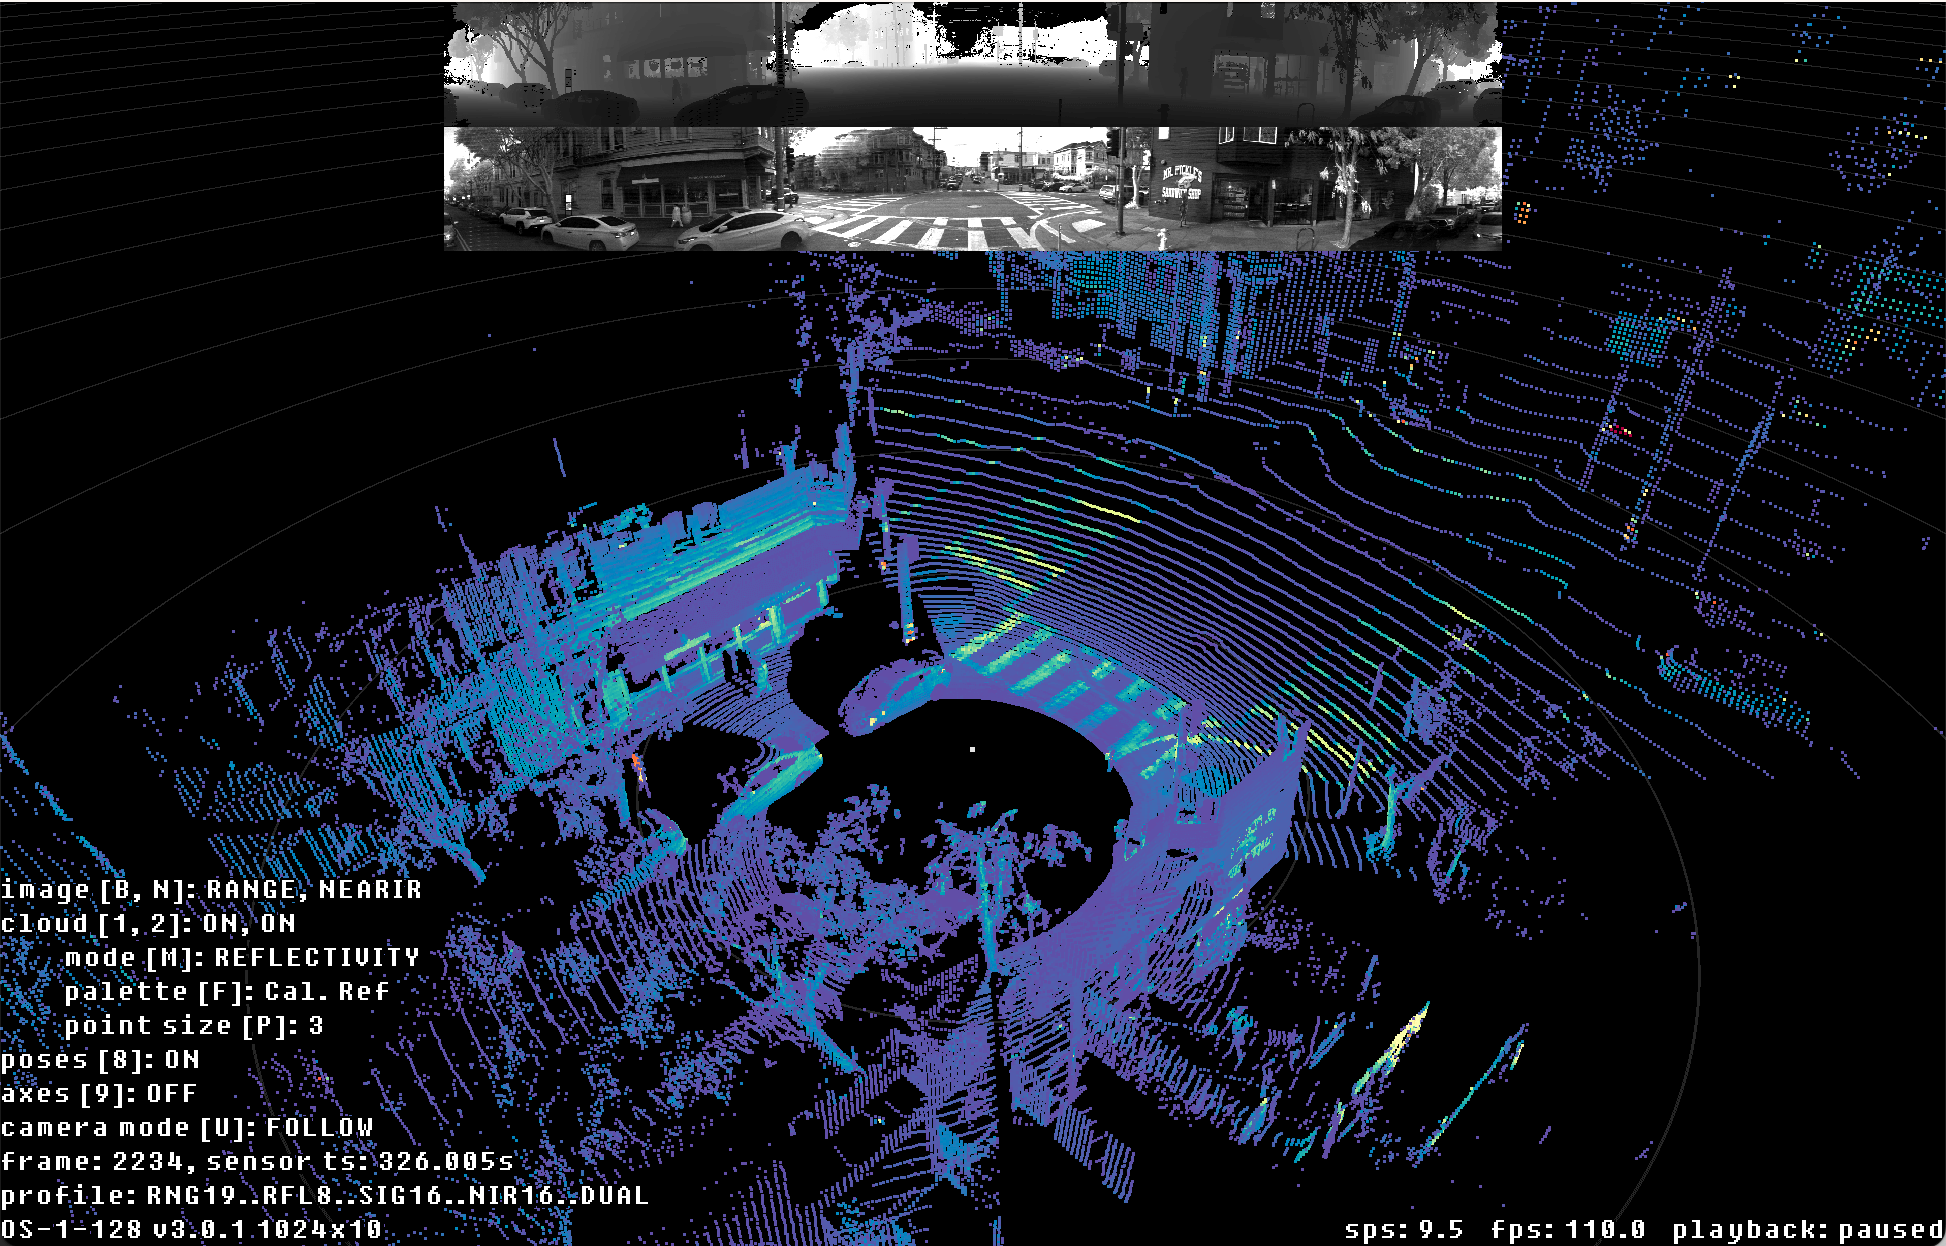
Ouster SDK CLI ouster-cli source <sensor | pcap | osf> viz visualization of OS1 128 sample data
You can control your visualizer with mouse and keyboard.
Click and drag rotates the view.
Middle click and drag moves the view.
Scroll adjusts how far away the camera is from the vehicle.
The default Ouster SDK CLI ouster-cli source <sensor | pcap | osf> viz visualizer view includes two 2D range images atop which can be cycled through the available fields, and a 3D point cloud on the bottom. For dual returns sensors, both returns are displayed by default.
Visualizer options
To get a list of all the options supported by the ouster-cli source … viz command, run:
ouster-cli source {SAMPLE_DATA_PCAP_PATH} viz --help
Keyboard controls
Press ? while the visualizer window is focused to print the current key bindings. The table
below summarizes the defaults:
- Camera
- Playback
Key
What it does
spaceToggle pause
. / ,Step one frame forward/back
ctrl + . / ,Step 10 frames forward/back
> / <Increase/decrease playback rate (during replay)
h / shift+hIncrease/decrease subframes (during replay)
- 2D View
Key
What it does
b / BCycle top 2D image
n / NCycle bottom 2D image
i / shift+iIncrease/decrease size of displayed 2D images
ctrl+iFlip or hide 2D images
- 3D View
- Other
Key
What it does
oToggle on-screen display
?Print keys to standard out
shift+zSave a screenshot of the current view
shift+xToggle a continuous saving of screenshots
ctrl+xToggle continuous screenshot format
v / shift+vCycle screenshot resolution factor
escExit
Extrinsics
The visualizer includes an option to control the orientation of the point cloud in space when
loaded. If you possess, say, an OS-DOME mounted upside down, you can start the visualizer with the
option --extrinsics:
ouster-cli source --extrinsics "-1 0 0 0 0 1 0 0 0 0 -1 0 0 0 0 1" {SENSOR_HOSTNAME} viz
The input is a row-major homogeneous matrix.
Note
All basic primitives that you see as part of ouster-cli visualizer are exposed through
viz.PointViz bindings. Please see the API reference for viz.PointViz for how to use it
programmatically in Python.
Subframes
When replaying recorded data, pass --subframes to interpolate the camera pose between frames and
visualize smoother motion. If the value is greater than zero, the visualizer linearly interpolates
between consecutive frames to produce that many intermediate frames per frame. You can also press
r or SHIFT+r while the visualizer is running to increase or decrease the subframe count.
Set SAMPLE_DATA_PCAP_PATH before running:
ouster-cli source {SAMPLE_DATA_PCAP_PATH} viz --subframes 10
Advanced usage with sensor
Running the viz command will auto-configure the udp destination of the sensor while leaving the lidar port as
previously set on the sensor. If your sensor is already configured appropriately, you may find it useful to
use the argument --no-auto-udp-dest to save time by skipping the round trip to reconfigure the
sensor.
Congratulations! You’ve installed and visualized with the Ouster Python SDK!