

Using the Visualizer
After installing the ouster-sdk package, the following visualizes lidar data arriving on a udp port. Note that you may have to use
ouster-cli source <SENSOR_HOSTNAME> config first to configure your sensor properly.
ouster-cli source {SENSOR_HOSTNAME} viz
where <sensor hostname> is the hostname (os-99xxxxxxxxxx) or IP of the sensor.
Alternately, the following replays lidar data saved in a pcap file and visualizes the output. It will looks for a
metadata json file with the same name as PCAP FILE by default, but you can specify a file using -m
<METADATA JSON>.
ouster-cli source --meta {SAMPLE_DATA_JSON_PATH} {SAMPLE_DATA_PCAP_PATH} viz
Use extrinsics input
The visualizer also includes an option to control the orientation of the point cloud in space when
loaded. If you possess, say, an OS-DOME mounted upside down, you can start the visualizer with
the option --extrinsics to adjust the visualization accordingly:
ouster-cli source --extrinsics "-1 0 0 0 0 1 0 0 0 0 -1 0 0 0 0 1" {SENSOR_HOSTNAME} viz
The input is a row-major homogeneous matrix.
For other options, run ouster-cli source <sensor | pcap | osf> viz -h
Note
All basic primitives that you see as part of ouster-cli visualizer are exposed through
viz.PointViz bindings. Please see the API reference for viz.PointViz for how to use it
programmatically in Python.
Adjust Playback Rate and Looping
To visualize the OSF at 1.5x speed while looping back:
ouster-cli source {SAMPLE_DATA_OSF_PATH} viz -r 1.5 -e loop
Advanced usage with sensor
The Ouster visualizer automatically configures connected sensors to send data to the appropriate UDP
destination address. If your sensor is already configured appropriately, you may find it useful to
use the argument --no-auto-udp-dest to save time by skipping the round trip to reconfigure the
sensor.
Streaming Live Data
Instead of working with a recorded dataset or a few captured frames of data, let’s see if we can get a live feed from your configured sensor:
# establish sensor connection via open_source
from ouster.sdk import open_source
with closing(open_source(hostname,
                         collate=False,
                         sensor_idx=0,
                         lidar_port=lidar_port)) as stream:
    show = True
    while show:
        for frames in stream:
            frame = frames[0]
            if frame is None:
                continue
            # uncomment if you'd like to see frame id printed
            # print("frame id: {} ".format(frame.frame_id))
            reflectivity = core.destagger(stream.sensor_info[0],
                                          frame.field(core.ChanField.REFLECTIVITY))
            reflectivity = (reflectivity / np.max(reflectivity) * 255).astype(np.uint8)
            cv2.imshow("scaled reflectivity", reflectivity)
            key = cv2.waitKey(1) & 0xFF
To exit the visualization, you can use ESC.
Here, we are using core.destagger to undo the azimuth pixel shifts in REFLECTIVITY channel. We will learn more about this in the next section.
Visualizing LidarFrame(s)
If you want to visualize a LidarFrame or a list of LidarFrame objects using the python API, you can use
ouster.sdk.viz.lf_show() method. Here is a code snippet that shows how it can be used to
visualize a list of LidarFrame:
from ouster.sdk import open_source
from ouster.sdk import viz
# Load a LidarFrame from a given source (could be a pcap file, OSF file, or a live sensor)
frame_set_source = open_source(source_url)
# Visualize the LidarFrame
frames = next(iter(frame_set_source))
viz.lf_show(frames)
# When using an indexed source you can do this instead
# where idx is a valid index value into the source
viz.lf_show(frame_set_source[idx])
This will open an interactive window displaying the LidarFrame as PointCloud.
Additionally, lf_show accepts a list or slice of LidarFrame(s).
To visualize multiple frames simultaneously:
viz.lf_show([frame_set_source[0][0], frame_set_source[1][0], frame_set_source[2][0]])
This example passes a list of frames to lf_show so they appear in the visualization window at the same time.
You can toggle each frame on/off within the visualizer using CTRL+1 through CTRL+9 to compare frames side by side. These
frames do not need to originate from the same source.
To visualize a range of frames from the frame source sequentially:
viz.lf_show(frame_set_source[0:stop]) # type: ignore[arg-type]
Here stop controls how many frames are included in the range. When played back in visualizer you can press
the spacebar to unpause the playback or use the < and > keys to step back and forth between frames.
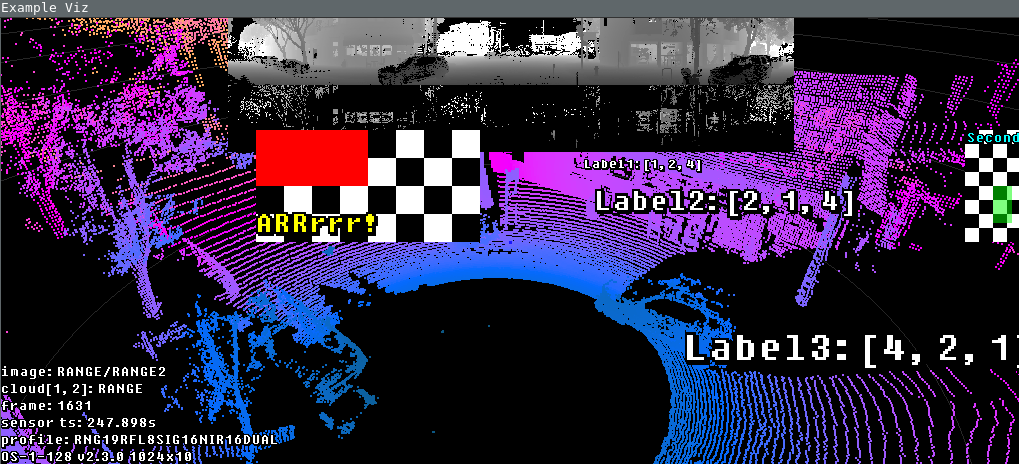
PointViz with Image, Label and masks applied
For more advanced visualization you can explore a programmatically accessible viz.PointViz
API.